




SitePoint SponsorsPublished inDevOps·Performance & Scaling·AI·
September 17, 2026
The AI briefing for Developers
Stay up to date with AI tools, model releases, and developer workflows that matter.
Weekly. Free. One click to leave.
SitePoint Premium
Stay Relevant and Grow Your Career in Tech
- Premium Results
- Publish articles on SitePoint
- Daily curated jobs
- Learning Paths
- Discounts to dev tools
7 Day Free Trial. Cancel Anytime.
Every IT team has a story like this.
A production server triggers a CPU alert at 11 p.m. The network admin sees CPU at 83% and ignores it because the server always spikes during its nightly batch job.
Three weeks later, the same server hits 83% CPU at 2 p.m. on a Tuesday. This time, a runaway process is causing the problem. But the alert looks exactly like the ones the team has been ignoring, so it gets dismissed again.
The problem isn’t the engineer. It’s the fixed threshold.
The problem with static thresholds
Static thresholds are easy to set: CPU at 80%, memory at 75%, disk at 85%. You can pick a baseline that seems reasonable for your network, and apply it across your servers.
But the problem is that servers don’t behave the same way all the time or even like one another. A threshold that makes sense for one workload can be completely wrong for another. Consider what happens in real environments:
- A SQL Server might regularly run at 70% CPU during business hours while sitting at 15% overnight. An 80% threshold may trigger repeatedly during normal peak activity, yet miss a problem when CPU hits 65% on a quiet Sunday.
- A web server running scheduled batch exports might hit 90% CPU for 20 minutes every night at 1 a.m. With an 80% threshold, the same alert shows up every night. Eventually, the team knows it’s routine and stops paying attention.
- A file server might gradually fill its primary volume over several months. The disk alert fires at 85%, someone archives old files, and everything looks fine for a while. Two months later, the alert fires again. The team doesn’t just need another disk-space warning. They need to know how quickly storage is filling up and when they’ll actually run out of space.
In each case, the static threshold is working fine based on the conditions. But, it isn’t telling the team whether something is actually wrong. That’s where alert fatigue becomes dangerous. The real problem isn’t just too many alerts. It’s that repeated false positives enable teams to ignore alerts, including the ones that genuinely need attention.
What adaptive monitoring does differently?
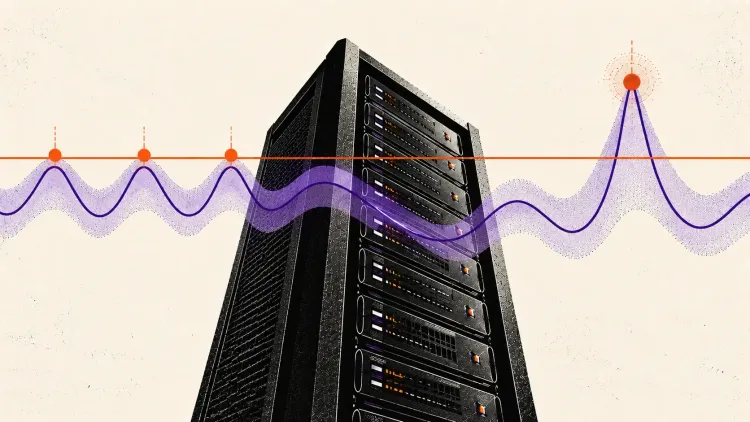
Adaptive monitoring changes the question from “Did this metric cross a fixed threshold?” to “Is this metric behaving unusually for this server, at this time, based on its normal pattern?”
Instead of applying the same threshold everywhere, adaptive monitoring learns what normal looks like for each server over time and builds a baseline that takes into account:
- Time-of-day patterns: A server that regularly uses high CPU during business hours shouldn’t trigger the same alert at 10 a.m. that it would at 2 a.m.
- Day-of-week patterns: Scheduled jobs, maintenance windows, and weekly business cycles can all affect resource usage. Adaptive monitoring accounts for these recurring patterns instead of treating every spike as a problem.
- Workload trends: If a server’s CPU usage has been steadily increasing over the past few months, the baseline can adjust with that trend instead of treating every increase as an anomaly.
This helps you treat the right deholds
Example
Let’s take the SQL Server. Over time, an adaptive model learns that its CPU usage typically reaches around 72% during business hours. So instead of triggering an alert every time usage gets high, it sets a higher threshold, around 85%, for that period.
Adaptive monitoring catches the unusual behavior when it matters and ignores the activity that’s normal for that server. Static thresholds often do the opposite.
How Machine Learning powers this in practice?
Modern AIOps platforms use machine learning to understand how metrics behave over time and spot patterns that fall outside the normal behavior. Instead of relying on a fixed threshold, the system learns what is normal for each server and adjusts alerts accordingly.
A typical approach looks like this:
- Collect metrics over time. The system gathers CPU, memory, disk I/O, and other performance metrics for each device.
- Build a baseline for each metric. Machine learning analyzes the data to identify trends, recurring patterns, and normal variations. For example, it may calculate the typical P95 CPU usage for different time windows over several weeks.
- Create dynamic thresholds. Warning and critical thresholds are then set relative to the baseline rather than using the same fixed value everywhere. For example:
- Warning: around 15% above the expected peak
- Critical: around 30% above the expected peak
- Keep learning as conditions change. As workloads and usage patterns evolve, the baseline updates with new data. If there is a major infrastructure change, teams can also trigger a fresh learning period.
- Alert when behavior changes. The system raises an alert when a metric moves significantly outside its expected pattern; not simply because it crossed an absolute number.
The key difference is that the threshold reflects what that specific server normally does, rather than a value someone configured years ago and never revisited.
Adaptive monitoring can also catch problems that static thresholds completely miss. Suppose a server normally runs at 55% CPU during business hours but suddenly drops to 20%. A static 80% threshold sees nothing wrong. But that sudden drop could mean a critical process has stopped handling requests.
Implementing Adaptive Thresholds with ManageEngine OpManager
OpManager’s AIOps engine, powered by Zia, brings adaptive thresholding into server monitoring without requiring data scientists or complex model configuration.
How adaptive thresholds work in OpManager?
Zia analyzes performance data from monitored devices and learns the normal behavior of metrics such as CPU, memory, disk I/O, network usage, and response time. Over the learning period, it builds a baseline for each device and metric.
Once the baseline is established, OpManager can use adaptive thresholds alongside or instead of traditional static thresholds. It also provides forecast data, helping teams understand where a metric is headed rather than looking only at its current value.
Configuring Zia-based adaptive thresholds
- Go to Settings -> Monitoring -> Zia AI -> Adaptive Thresholds.
- Select the device or device group where you want to enable adaptive monitoring.
- Choose the metrics you want to monitor, such as CPU, memory, disk, or network usage.
- Set the sensitivity level to control how much a metric must deviate from its baseline before an alert is triggered. Lower sensitivity means fewer alerts, while higher sensitivity can catch smaller deviations.
- Choose whether adaptive thresholds should replace existing static thresholds or work alongside them during the transition.
OpManager also includes Zia Insights, which turns detected anomalies into easy-to-understand summaries, helping teams quickly see what is happening across their environment. Zia can run through the cloud or with a locally deployed Ollama instance for teams that prefer to keep monitoring data within their own environment.
Alert Correlation: The other half of the problem
Adaptive thresholds help reduce false positives: alerts that fire even when everything is operating normally. But the real challenge is alert storms, where a single failure triggers a flood of related alerts.
For example, if a network switch goes down and 40 servers become unreachable, the monitoring system may generate 40 separate alerts. Each alert is technically correct, but looking at them individually makes it harder to see what actually went wrong. The real issue is the switch; the unreachable servers are just symptoms.
AIOps-based alert correlation connects these related alerts and groups them into a single incident, helping teams identify the likely root cause faster. OpManager’s root cause analysis correlates alerts based on factors such as network paths, device dependencies, and timing, then points to the most likely cause automatically.
What this means for on-call teams?
The goal isn’t just to reduce alerts. It’s to make sure the alerts teams receive actually matter.
If a team gets 20 useful alerts a day, they can investigate each one. But if they get 200 alerts and most are noise, they’ll eventually start ignoring them. This in turn leads to missing a potential outage.
This also affects MTTR. When an alert is meaningful, the team can start fixing the problem right away. When alerts are often false positives, the first question becomes, “Is this really a problem?” That hesitation can slow down response.
In 2026, collecting metrics is no longer enough. The real value is in understanding which changes are normal, which need attention, and which signal a real problem.
Summary
Static thresholds worked well when IT environments were smaller and workloads were more predictable. Today, infrastructure is constantly changing, making fixed thresholds less effective. Adaptive monitoring uses learned baselines, dynamic thresholds, anomaly detection, and alert correlation to keep monitoring accurate as the environment changes. The goal isn’t to generate more alerts. It’s to deliver the right alert, for the right device, with enough context for the team to take action immediately.
Sponsored posts are provided by our content partners. Thank you for supporting the partners who make SitePoint possible.
