



Community Article
Community articles are authored by SitePoint Premium contributors. Content is screened before publication, and SitePoint reserves the right to moderate or remove articles that violate our guidelines. Views expressed are those of the authors and do not necessarily reflect those of SitePoint.
From Symptoms to Systems: Understanding Observability
Published inPerformance·Cloud·Performance & Scaling·Software·
July 25, 2026
SitePoint Premium
Stay Relevant and Grow Your Career in Tech
- Premium Results
- Publish articles on SitePoint
- Daily curated jobs
- Learning Paths
- Discounts to dev tools
7 Day Free Trial. Cancel Anytime.
Do you think both are same? NO!!!!! Let’s read a story
The Tale of Two Drivers: Monitoring vs. Observability
Imagine two drivers, Adam and Ryan, both commuting down a busy highway in identical modern SUVs.
STORY 1 – FUNDAMENTAL Analysis
Part 1: Ryan Relies on Monitoring
Ryan drives looking strictly at the dashboard.
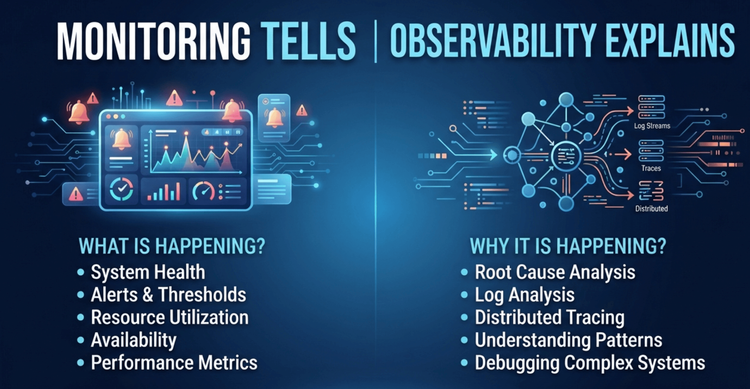
The dashboard is reliable. It displays the current speed, the fuel level, and the engine temperature. Ryan has also set up physical “alerts” — if the car goes over 70 MPH, a chime sounds. If the fuel drops below 10%, a bright yellow light turns on. This is Monitoring. It tracks known metrics against predefined thresholds.
Suddenly, forty miles into the trip, the SUV violently sputters, loses power, and grinds to a halt on the shoulder.
Ryan looks at the dashboard in confusion. The fuel gauge says half full. The engine temperature is normal. No warning lights are on. Ryan knows what happened — the car stopped moving — but the dashboard lacks the context to explain why. Ryan is trapped, blind, waiting for an expensive tow truck to hook up diagnostic tools.
Part 2: Adam Utilizes Observability
Adam is driving the exact same route, but Adam’s SUV is equipped with a modern Observability system.
Adam has the same dashboard as Ryan, but the car’s internal computer continuously streams rich telemetry data from inside the engine. It logs every fuel injection, tracks vibrations in the transmission, and traces the electrical current flowing from the battery to the spark plugs.
Thirty miles into the journey, Adam’s system detects an anomaly: a microscopic, irregular drop in fuel pressure whenever the car accelerates past 50 MPH.
Adam doesn’t just get a generic “engine broken” light. The system highlights a distributed trace of the fuel system, showing that a specific batch of low-quality fuel bought that morning is clogging the fuel injector on Cylinder 3.
Adam doesn’t have to guess or wait to break down. Because the system is observable, Adam pulls over safely at the next exit, replaces the injector filter, and continues the drive without ever needing a tow truck.
- Monitoring (Ryan) is a dashboard of checkboxes. It works perfectly for simple, predictable systems. But when a complex cloud environment breaks in a brand-new way, monitoring leaves you stranded on the side of the road.
- Observability (Adam) gives you the tools to interrogate your system. It allows your engineers to ask why something is happening under the hood, pinpointing the exact microservice, database query, or line of code causing the delay before it crashes your business.
Monitoring relies on dashboards and alerts that you configure ahead of time. You decide which metrics matter — such as HTTP 500 error rates or server memory — and set a threshold. If the system passes that threshold, an alert triggers.
- The Limit: If a complex, multi-service system fails for a highly specific, unprecedented reason, your traditional monitoring dashboards will show red, but they will not tell you which microservice or code change caused the failure.
Observability relies on rich telemetry data emitted by the system itself. Instead of just looking at hardware metrics, your software is instrumented to explain its own behavior through context. It assembles cross-system data using M.E.L.T.:
- Metrics: Numeric values over time (e.g., request rates).
- Events: Discrete actions that occurred (e.g., a code deployment).
- Logs: Detailed, timestamped text records of specific events.
- Traces: The end-to-end journey of a single request across dozens of microservices.
Snippet 1
- The Scenario: Black Friday. 50,000 requests per minute.
- The Incident: Customers are seeing HTTP 500 errors on the checkout page.
Notes — “To understand the difference between monitoring and observability, let’s look at a realistic production incident. Imagine an e-commerce app running on Kubernetes. Everything is fine until peak traffic hits on Black Friday. Suddenly, checkout requests start dropping. We are going to follow two different on-call engineers — Patty, who relies on monitoring, and Bob, who uses an observability platform.”
Snippet 2
- Monitoring: Alerts on symptoms (What is broken).
- Observability: Maps the blast radius (Where it is broken)
Notes — “Both engineers get paged at the exact same time because the checkout page is throwing 500 errors. Patty opens her traditional monitoring dashboard. She sees the error count metric spiking. She checks her infrastructure — CPU, memory, and disk utilization are all perfectly healthy. Her monitoring tools told her what is broken, but because the infrastructure looks fine, she is stuck. Meanwhile, Bob opens his observability platform and looks at a live Service Map. He instantly sees a visual bottleneck lighting up right between the API Gateway and the Checkout Service. He hasn’t solved it yet, but he immediately knows exactly where to look”
Snippet 3
- Monitoring Silos: Disconnected metrics and raw log aggregators.
- Observability Context: Unified M.E.L.T. (Metrics, Events, Logs, Traces)
Notes — “Now the hunt begins. Patty has to dig through her logs. She opens her log manager and searches for the word ‘error.’ She gets hit with a firehose of 10,000 log lines per second. She has to manually copy the timestamp from her metric graph and try to match it to the text logs. She’s wasting critical minutes trying to correlate two completely different tools. On the other hand, Bob clicks directly on the failing link in his Service Map. Because his platform uses distributed tracing to weave metrics and logs together using a single trace ID, the tool automatically filters out the noise and hands him a precise sample of the failing transactions.”
Snippet 4
- The Monitoring Limit:
java.net.SocketTimeoutException(A dead end). - The Observability Insight: Unindexed sequential table scan on
user_coupons.
Notes — “Patty finally finds an error log. It says ‘SocketTimeoutException.’ She thinks the payment vendor is down, but the vendor insists their API is healthy. She is at a dead end because traditional monitoring cannot see inside the network hop. Bob looks at his trace timeline. It maps the request end-to-end like an architectural blueprint. He sees that the Checkout Service didn’t fail at the payment vendor — it timed out internally at 3 seconds because a specific database query took 4.8 seconds to run. He clicks into the trace payload and finds that a database index was accidentally dropped during a deployment, forcing a slow table scan. He has found the why.”
Snippet 5
- Monitoring: Passive guardrails for known problems- 1 Hour 45 Minutes | Extreme Stress | High Revenue Loss.
- Observability: Active diagnostics for unknown problems- 7 Minutes | Calm Resolution | Minimal Revenue Impact.
Notes — “Let’s look at how this ends. Patty’s team spent nearly two hours restarting pods, pulling in senior database administrators, and guessing before they found the missing index. Bob identified the exact dropped index, ran a migration script to fix it, and watched his latency graphs return to normal in just 7 minutes. This isn’t just about technical convenience — it’s about business survival. Monitoring works well for simple, predictable systems. But in complex, cloud-native applications, you will face unpredictable bugs. Monitoring leaves you guessing; observability gives you answers.”
WRAP UP!!
- Pre-aggregation vs. Raw Cardinality: Monitoring relies on pre-aggregated data (averages, counts). It destroys fine-grained details to save storage. Observability preserves high-cardinality data (IDs, user context, trace headers), letting you ask questions you didn’t plan for.
- Silos vs. Context: Monitoring keeps logs in one tab, metrics in another, and APM in a third. Observability weaves them together with a single trace ID so you can jump from an infrastructure spike straight to the offending line of code.
- Passive vs. Active Interrogation: Monitoring is a passive guardrail waiting to be tripped. Observability is an active diagnostic laboratory that lets an engineer interrogate a living distributed system.
